What is the context?
These features are available today to make clinical forms easier to use, more responsive to patient data, and clearer when sharing key information. With smarter clinical forms and visual charting, Meddbase is making it easier for clinicians to capture the right details quickly and clearly. By adapting to the data being entered and presenting it in a more intuitive way, these tools help reduce admin time, improve accuracy, and support better collaboration across teams.
What is the purpose of the article?
This article covers the following topics:
- Buttons in Clinical Forms
- Visibility Rules
- Smart Clinical Forms: Build Automatic Logic Using Calculations, Functions and Binding
- Who Can Use These Features?
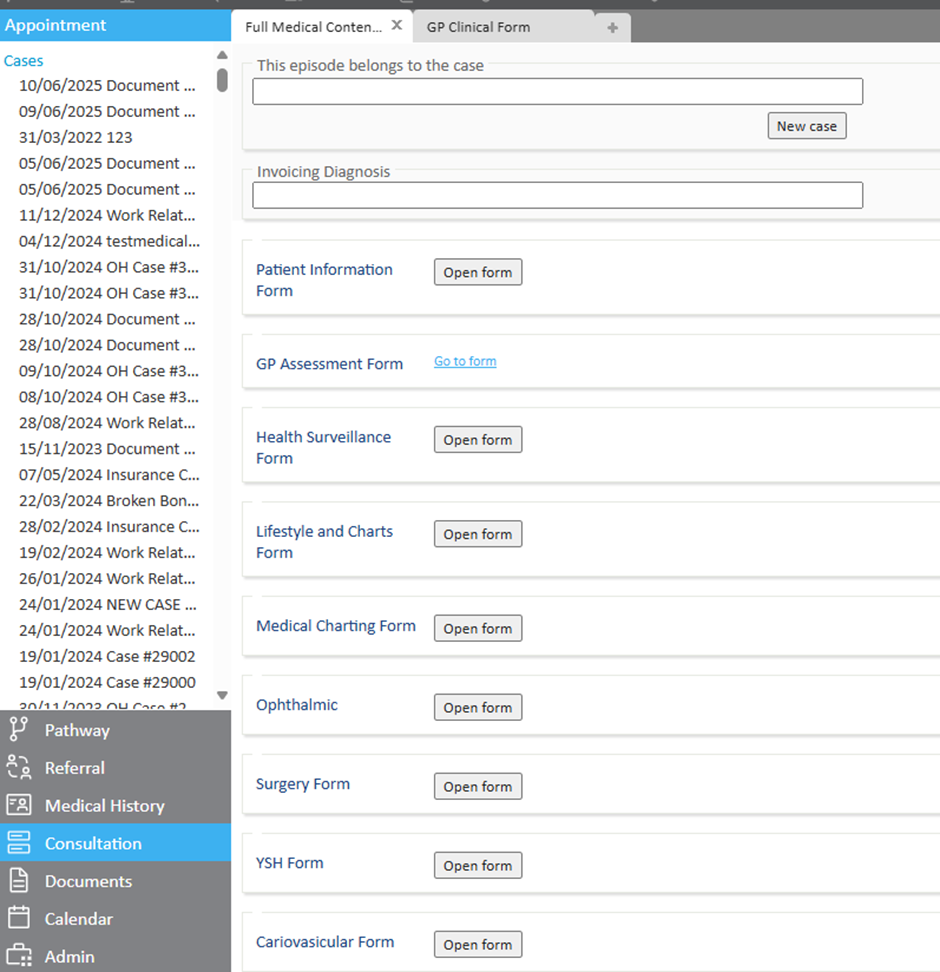
Buttons in Clinical Forms
Move quickly between forms or sections
Buttons allow clinicians to open other forms or jump to specific sections with a single click, ideal for longer or multi-step assessments.
Helpful for:
- Full medicals and multi-part assessments
- Grouping forms by clinical area (e.g. Respiratory, MSK, Mental Health)
- Reducing scrolling and making forms easier to manage
Visibility Rules
Only show what's relevant—as you go
Forms can now adapt in real-time. Questions appear (or stay hidden) based on earlier answers. For example, ticking a box, typing a symptom, or selecting from a dropdown.
Why it helps:
- Keeps the form focused on the patient in front of you
- Reduces unnecessary questions and visual noise
- Helps prevent missed fields or inputs
- Supports a more natural flow in the consultation
Visual Charts in Forms and Documents
Make clinical data easier to see and explain
Charts can now be added directly into forms and documents. They help clinicians and patients understand values, trends, or risks at a glance, and you can interact with them to focus on the data that matters most.
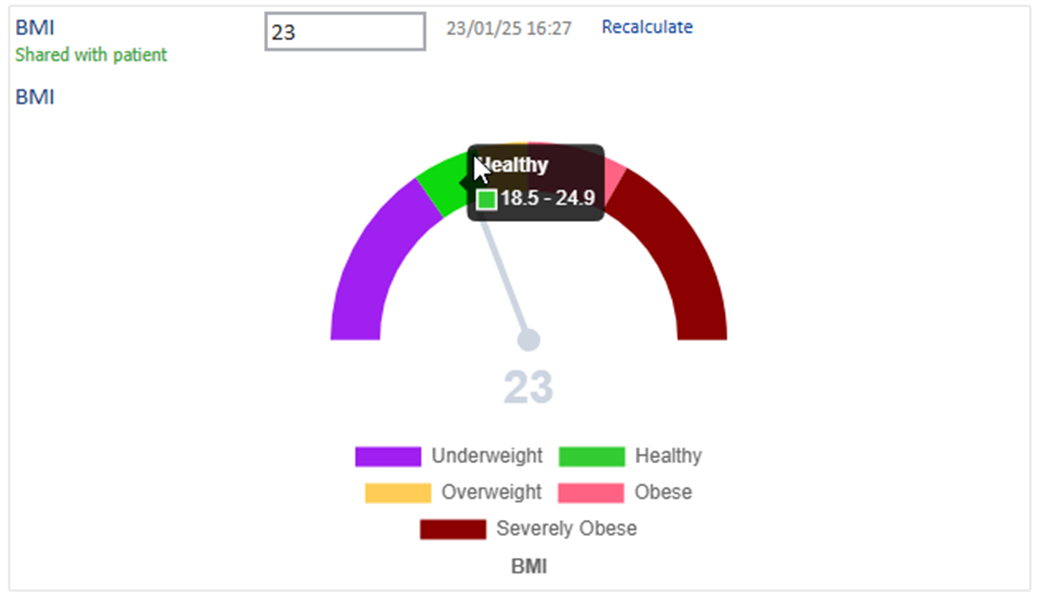
Available chart types include:
Gauge: Shows a risk score on a dial
e.g. blood pressure or BMI risk score
Stack: Shows a result within a range
e.g. screening result in a reference range

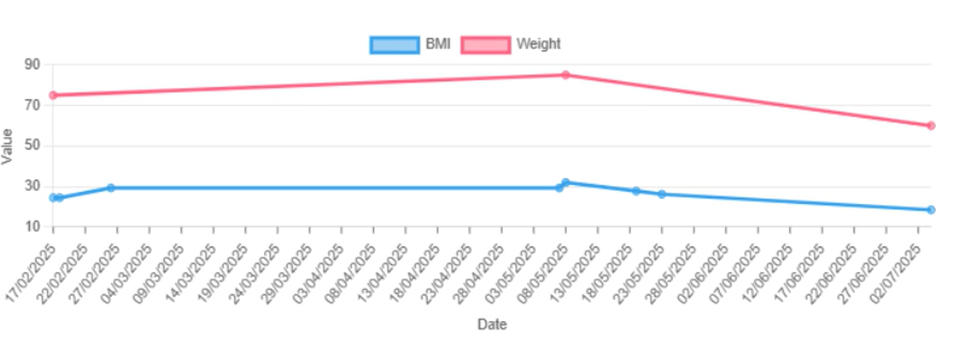
Bar: Can display data over time
e.g. dosage levels, weight, BMI

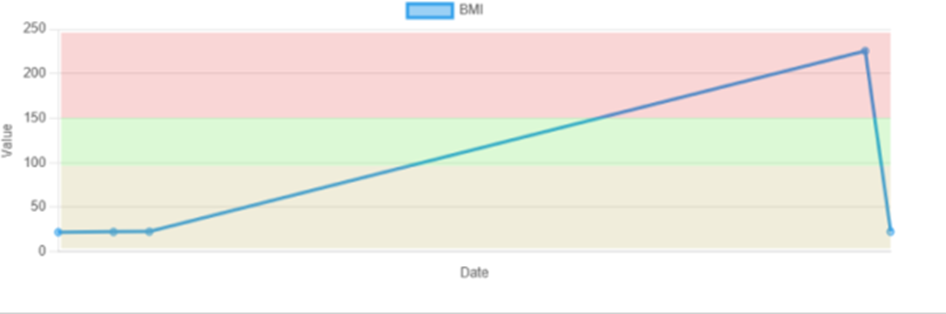
Line: Shows changes over time
e.g. weight or blood sugar history
Colour styling: For quick visual feedback
e.g. red/yellow/green zones for quick reference
Why it helps:
- Quick visual reference for clinical decisions
- Compare multiple data points and toggle between them as needed
- Easier to communicate results to patients
- Works well in both forms and documents
To use a chart in a document, just add the following template code to your template: {Charts.CHARTNAME}
Smart Clinical Forms: Build Automatic Logic Using Calculations, Functions and Binding
Turn patient data into automatic insights
Meddbase can now calculate values (like BMI), interpret them using logic (like risk scores), and display tailored advice based on the result, all within the form.
Calculations
Use entered data (e.g. height + weight) to auto-calculate values.
Functions
Functions can range from simple logic (e.g. age + BP = risk level) to complex formulas that pull from multiple parts of the medical record.
Example: If…
- Blood pressure is 140–155
- Ethnicity is Indian
- Age is under 50
→ return: "Low Risk"
If same BP and ethnicity, but age is over 50 → "High Risk"
Some organisations choose to use licensed or nationally recognised clinical algorithms such as QRISK, if a customer provides the licensed algorithm we can then format and configure it to work within your workflow.
Binding
Displays information associated with the function result directly in the form, such as:
- “High risk male patient – consider referral”
- “Moderate risk – review in 6–12 months”
- “Low risk – routine monitoring”
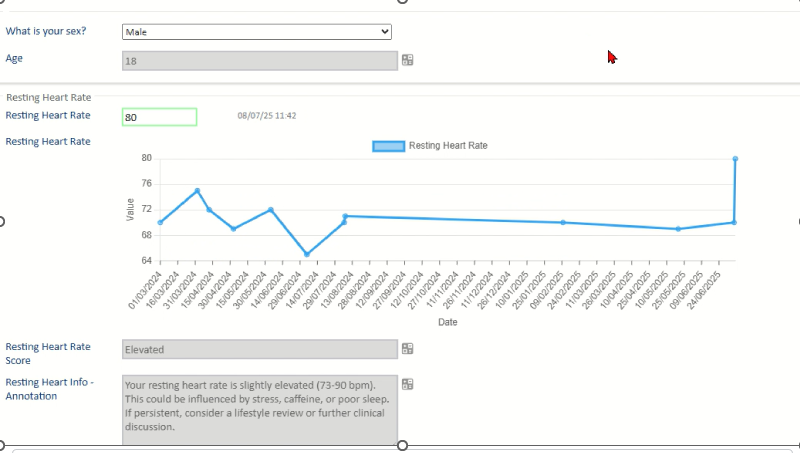
In the below image examples:
Entering a resting heartbeat of 80 for an 18-year-old male automatically triggers a score of ‘Elevated’ - this is the Function working. The associated binding then shows relevant follow-up guidance in the form.
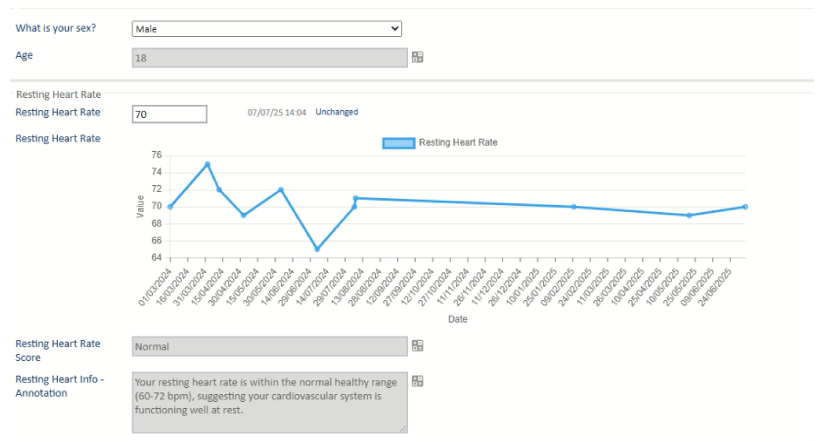
Entering a heartbeat of 70 for the same person automatically indicates normal range
Note: These outputs are tools to support clinical decisions, not replace them.
This video demonstrates binding in action:
Why it helps:
- Reduces manual entry
- Creates more consistent assessments
- Supports safer, clearer decisions
- Improves patient understanding
Who Can Use These Features?
Charting and Smart Forms are available to all customers on a Core, Plus or Pro Meddbase plan.
- There’s no additional charge for using these features
- Charts do have to be created by the Meddbase team
- The time taken to build a chart will come from your existing allowance
- Once built, charts can be reused in clinical forms and document templates - template code {Charts.CHARTNAME}
To get started:
- Raise a support ticket with your request
- Or speak to your Account Manager if you’re unsure of your plan
If you're not yet on Core, Plus or Pro, we’d be happy to talk through options.
Review date
This article was last updated on 7th August 2025